


Dashboards and Business IntelligenceDashboards provide a complete view of the most important information on your workforce, employee training, evaluations and appraisal. Designed to be both flexible and highly visual Simplex Dashboards allow users to focus on the most significant performance aspects of the workforce and training delivery allowing quick and easy monitoring of key performance indicators to support follow up and action. |
 |
|||
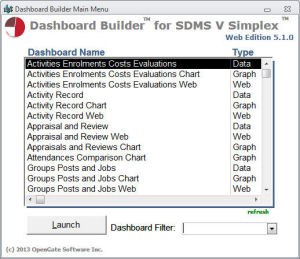
Dashboard Data Visualisation Module for SDMS V Simplex The Simplex Training and HR Dashboard Module provides an immediate, complete and easily understood visual presentation of key training performance indicators for your organisation.
These are just some of the pre-set up Dashboards included with the Module - you just click and run. It also includes full Dashboard Administration allowing users to design and deploy their own Dashboards to meet the company’s day to day information needs. Dashboards provide a complete view of the most important information on your Workforce such as training, evaluations and appraisal. Designed to be both flexible and highly visual, Simplex Dashboards allow users to focus on the most significant performance aspects of the workforce and training delivery. |
||||
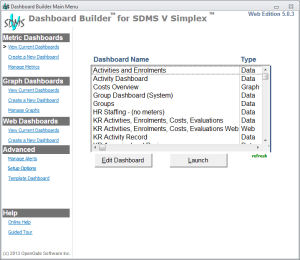
Training and HR Key Performance Indicator Dashboards The Simplex Dashboard Module is supplied with a range of pre written Training and HR Performance Indicator Dashboards. These include:
Each Dashboard can be run for a particular year or group. |
Features: Quickly define Dashboards with the key metrics and KPIs you want to monitor to give visually informative information to help you make decisions:
|
|||
|
||||
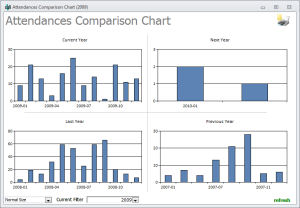
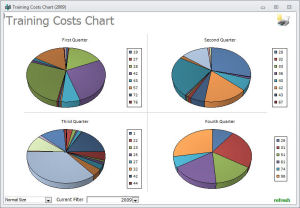
“Types of Dashboard - Metric, Graphical and Web - You can make Simplex data work for you and enhance the quality of training and development in the organisation by presenting it in a variety of visual styles and outputs to suit your needs, whether this is to include in a Board or Governors HR Report or quality Inspection”. |
||||
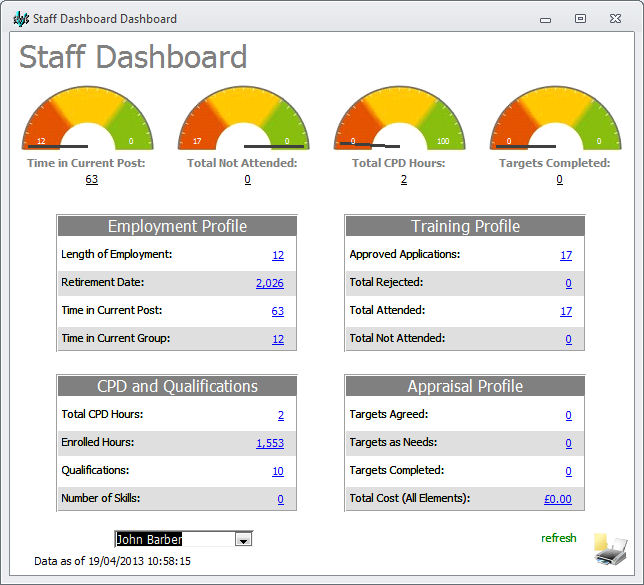
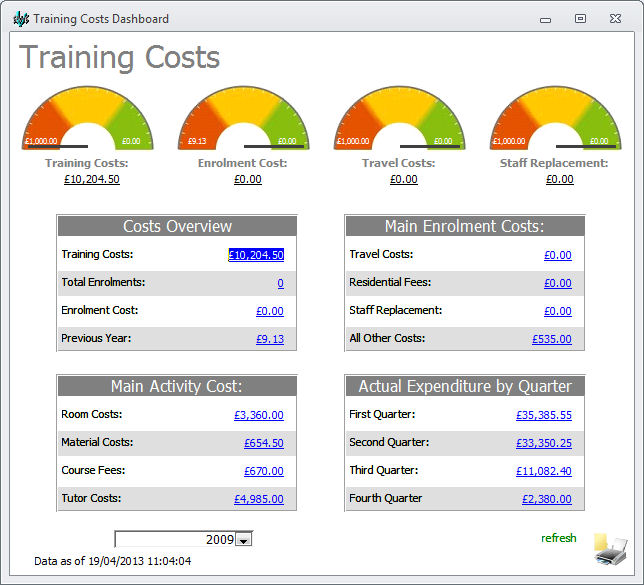
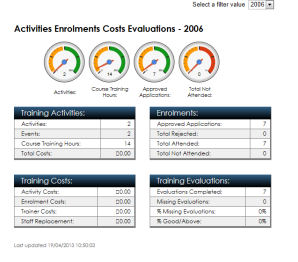
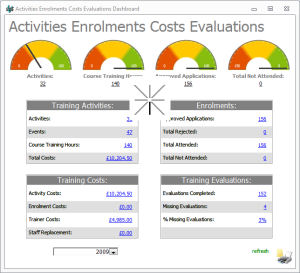
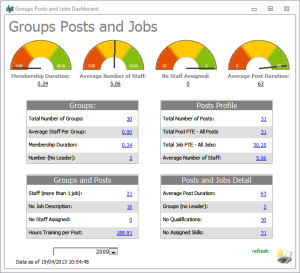
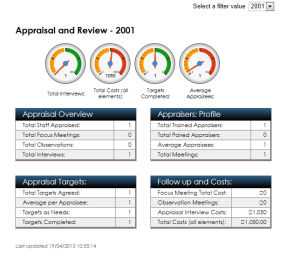
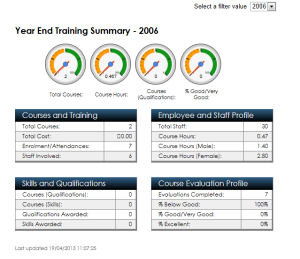
Metric Style with Speedo Meters The metric style dashboard with speedo views is often the most appropriate way to show 4 groups of interconnected data such as course provision, enrolments, evaluation and costs while showing real time data in a speedo view. Green/red warnings are defined by the user in terms of their own KPI criteria. |
||||
 |
 |
|||
Web Dashboards Keeping staff and managers up to date with what training has been done across the business or in particular parts of it is made simpler by Simplex Web Dashboards which can be posted directly to your staff web portal or internal servers. Web enabled dashboards can be published to local directories and any web directory so that they can be viewed in standard browsers such as Internet Explorer, Firefox, Chrome, Safari. |
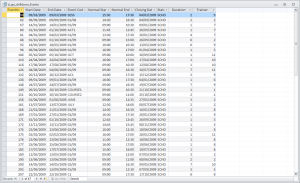
Drill Down The easy to grasp and visual Simplex Dashboards often lead to questions about what made up the data in the dashboard. This is supported by the ability to drill down into the chart to see the data. |
|||
 |
 |
|||
The Dashboard Administration Module - Write Your Own Dashboards The out of the box usability of the Simplex Dashboard Module with its pre-written dashboards is extended and complemented by the Simplex Dashboard Administration Module. This provides you with all the tools to write your own dashboards as and when you want. Of course, SDMS Support is always on hand to help and advise. On Line Training is of course available to help you but Simplex Dashboards Administration is designed for technically competent end users not programmers. |
||||
 |
 |
|||
Benefits of Simplex Dashboards Getting to grips with large amounts of complex training and staff data so that we can see the wood from the trees is the single most important benefit to you and your business of the Simplex Dashboard Module, together with:
|
||||
 |
 |
|||
 |
 |
|||
 |
 |
|||
For More Information: For more information please contact SDMS Ltd's Sales and Business Development Team by email: sales@sdmsltd.com or on 01952 200911
|
To Purchase: To Purchase SDMS V Simplex Dashboards Module please contact SDMS Ltd's Sales and Business Development Team by email: sales@sdmsltd.com or on 01952 200911 |
|||